
We share some building blocks for rolling your own error reporter in Delphi. From intercepting unhandled exceptions, to retrieving a stack trace to symbolicating the error report. This part focuses on iOS. In the next part, we handle Android, which does things a bit differently.
We won’t cover Windows here, since there are already some very good tools available for this platform, such as EurekaLog and MadExcept.
You can find the accompanying source code on GitHub as part of the JustAddCode repository.
Note that we do not present a complete exception logging and tracking solution here. We merely present some building blocks that you can integrate into your own solution.
Why do you need an Error Reporter?
I know you write solid code and thoroughly test it before you release your app in the wild. But bad things happen. So you want to be notified about this so you can improve your app and those bad things become less and less likely. And your customers will be happier.
Also, you probably don’t have the resources to test your app on all types of devices out there (especially when it comes to Android), in all kinds of different scenarios. Some errors may only happen on devices you haven’t tested. So the only way to find out is to report them somehow.
Existing Solutions
There are existing crash reporting solutions for iOS and Android, like Crashlytics and Apteligent (formerly known as Crittercism). However, these tools are mostly geared towards Objective-C/Swift (iOS) and Java (Android) environments and hard or impractical to use with Delphi apps. In addition, these tools rely on debug information to symbolicate crash reports. The debug information that Delphi generates is incompatible or insufficient for these needs.
There are also (free) services like HockeyApp that allow you to post custom crash reports in your own format. So you can use the building blocks in this article to create a crash report and send it over to HockeyApp.
Block #1: Intercepting Exceptions
The first step is to intercept any unhandled exceptions. You don’t want to intercept handled exceptions because, well, these are handled already and usually do not indicate a potential bug in the app.
The easy way to intercept unhandled exceptions is by assigning the Application.OnException event. In the sample code for this article, we created a TgoExceptionReporter class. To have it handle the OnException event, you add this line to your code:
Application.OnException := TgoExceptionReporter.ExceptionHandler;
This certainly works, but is not enough. This event only gets fired for exceptions that are raised in the main (UI) thread. Unhandled exceptions in secondary threads are usually eaten and ignored by default.
To intercept exceptions from other threads, you can assign the global ExceptionAcquired routine. Finally, if there are still exceptions that aren’t handled by these two routines, then the global ExceptProc function variable called. By default, this is set to the ExceptHandler routine in System.SystemUtils. This just shows the exception to the user and terminates the app.
The TgoExceptionReporter class redirects both these routines and ultimately forwards them to TgoExceptionReporter.ReportException which takes care of the rest.
Block #2: Retrieving a Stack Trace
Arguably the most valuable information in your error report will be a stack trace that shows the call stack leading up to the exception.
iOS makes this fairly easy for us with an API called backtrace, which is available in the libSystem.dylib module. Delphi doesn’t provide an import for this API, but we can easily import it ourselves:
const
  libSystem = '/usr/lib/libSystem.dylib';

function backtrace(buffer: PPointer; size: Integer): Integer;
  external libSystem name 'backtrace';
This API expects a pointer to an array of pointers that will be filled with the stack trace addresses, as well as the maximum number of elements that can be stored in this array. It returns the actual number of elements stored in the array. So you can call it like this:
var
  CallStack: array [0..19] of Pointer;
  Count: Integer;
begin
  Count := backtrace(@CallStack, Length(CallStack));
end;
However, if you request the stack trace in the exception handler, then you are too late. By that time Delphi has already unwound the stack all the way up to the point the exception is finally handled, and the information that is left on the stack will most likely be useless at that point. Instead, you want to retrieve the stack trace as close to the location of the exception as possible.
More hooking
Fortunately, Delphi provides a hook for us to hook into to get a stack trace. As you may have noticed, the Exception class has two properties called StackTrace and StackInfo. Now you may think “wait, if Delphi already provides this information, then why go through the trouble of getting a stack trace ourselves?”. Well Delphi doesn’t provide this information, and StackTrace will always return an empty string. Instead, it provides a hook for third parties (or yourself) to provide this information, through the static class variables GetExceptionStackInfoProc, CleanUpStackInfoProc and GetStackInfoStringProc of the Exception class. GetExceptionStackInfoProc gets called soon after the exception is raised, and this is where we need to retrieve the call stack. So we can hook into it like this:
Exception.GetExceptionStackInfoProc := HookedGetExceptionStackInfo;

function HookedGetExceptionStackInfo(P: PExceptionRecord): Pointer;
...
The hook retrieves information about the exception and must return a pointer to some call stack information in a format that is up to you. For example, you can allocate some memory to hold up to 20 addresses (pointers), perform the stack trace, and return this memory. In our sample code, we dynamically allocate a record that contains both the call stack and the actual number of items in the call stack:
type
  TCallStack = record
    Count: Integer;
    Stack: array [0..19] of UIntPtr;
  end;
  PCallStack = ^TCallStack;

function HookedGetExceptionStackInfo(P: PExceptionRecord): Pointer;
var
  CallStack: PCallStack;
begin
  { Allocate a PCallStack record large enough to hold 20 entries }
  GetMem(CallStack, SizeOf(TCallStack));

  { Use backtrace API to retrieve call stack }
  CallStack.Count := backtrace(@CallStack.Stack, Length(CallStack.Stack));

  { Return call stack }
  Result := CallStack;
end;
After the exception is handled and the exception object is destroyed, the CleanUpStackInfoProc hook is called to release any memory you allocated. So we need to hook this as well:
Exception.CleanUpStackInfoProc := HookedCleanUpStackInfo;

procedure HookedCleanUpStackInfo;
begin
  { Free memory allocated by GlobalGetExceptionStackInfo }
  if (Info <> nil) then
    FreeMem(Info);
end;
The TgoExceptionReporter class hooks both these routines to retrieve and release the call stack.
Then, in the actual exception handler, you can get to the call stack using the Exception.StackInfo property:
procedure TgoExceptionReporter.ReportException(const AExceptionObject: TObject;
  const AExceptionAddress: Pointer);
var
  E: Exception;
begin
  ...
  if (AExceptionObject is Exception) then
  begin
    E := Exception(AExceptionObject);
    if (E.StackInfo <> nil) then
      GetCallStack(E.StackInfo).
  end;
  ...
end;
We’ll get to the GetCallStack method next.
Note that Delphi will call
GetExceptionStackInfoProcfor every exception that is raised, also for exceptions that will be handled. This adds some overhead to the exception raising process, so you want to do as little as possible in this hook. So in our example, we just retrieve the call stack, but don’t perform any symbolication yet. We only need to do that when the exception isn’t handled and it finally arrives at our exception reporter. You may think that retrieving the call stack is still quite a bit of overhead. But remember that raising exceptions is an “expensive” operation anyway, and most or the time, exceptions will (and should) only be raised in exceptional circumstances (duh).
Block #3: Symbolicate the Stack Trace
A call stack with just an array of return addresses isn’t very useful. We want to know where in the source code those addresses are. Converting an address to a source location is called symbolication. For each address, we would like to know the following things:
- The name of the routine/method at this address, preferably in Pascal format.
- The address of the start of the routine. By subtracting this value from the stack trace address, you know the offset in the routine where the exception occured, or where another routine in the call stack was called.
- The name of the module containing the address. The address may not be in the executable, but in a dynamic library that is used by the executable. For example, it may be some system library.
- The base address of this module. We use this information to check if the address lies somewhere in our executable or not.
We store this information in a record of type TgoCallStackEntry:
type
  TgoCallStackEntry = record
  public
    CodeAddress: UIntPtr;
    RoutineAddress: UIntPtr;
    ModuleAddress: UIntPtr;
    RoutineName: String;
    ModuleName: String;
  end;
Note that the addresses are of type
UIntPtr. These are unsigned integers, so they can easily be converted to text. But the size of these integers match the size of aPointer. So they areUInt32‘s on a 32-bit system andUInt64‘s on a 64-bit system.
Ideally, we also want to know the exact line number in the source code, but unfortunately Delphi doesn’t provide this, even when “Full Debug Information” is enabled. But by calculating the offset in the routine as mentioned above, you at least get an idea of how far “into the routine” the error happened.
Retrieve the Symbol Names
So we want to know the name of the routine associated with an address. iOS provides a one-step API to convert all addresses returned by backtrace to an array of symbol names, called backtrace_symbols. The returned symbols are strings that contain additional information, such as addresses and module information. We would have to parse this string to retrieve this information.
There is a better solution that also works on Android. The dladdr POSIX API, converts just a single address, but returns all information in a nice record of type dl_info. You call it like this:
var
  Info: dl_info;
begin
  if (dladdr(AEntry.CodeAddress, Info) <> 0) then
  begin
    { Info contains:
      * dli_fname: module name
      * dli_fbase: (base) module address
      * dli_sname: symbol name
      * dli_saddr: symbol address }
  end;
end;
We care most about dli_sname here. This is a MarshaledAString containing a mangled version of the symbol name. It may look like this:
__ZN6System8Sysutils14TStringBuilderC3ENS_13UnicodeStringEi
This looks mangled indeed. You can probably figure out that this is somewhere inside the System.SysUtils.TStringBuilder class, but what about the last part of this string?
Demangle the Symbol Names
Delphi uses the name mangling scheme that is defined in the Itanium C++ ABI. We could try to demangle it ourselves using the specification. However, the mangling scheme uses some features (such as substitutions) that make this a non-trivial operation.
But fortunately, there is a (somewhat hidden) API for this called __cxa_demangle. On iOS, this is part of libSystem and we have to import it ourselves again:
function cxa_demangle(const mangled_name: MarshaledAString;
  output_buffer: MarshaledAString; length: NativeInt;
  out status: Integer): MarshaledAString; cdecl;
  external libSystem name '__cxa_demangle';
You feed this API a mangled name and it converts it to an unmangled C++ name. You can demangle the name to a buffer you manage yourself, by filling in the output_buffer and length parameters. But it is easier to set these parameters to nil and 0 and have the API allocate the buffer. In that case, you need to call Posix.Stdlib.free to free the returned buffer. So you can call it like this (using the Info.dli_sname value returned from dladdr above):
var
  Status: Integer;
  Demangled: MarshaledAString;
  RoutineName: String;
begin
  Demangled := cxa_demangle(Info.dli_sname, nil, 0, Status);
  if (Demangled = nil) then
    RoutineName := String(Info.dli_sname)
  else
  begin
    RoutineName := String(Demangled);
    Posix.Stdlib.free(Demangled);
  end;
end;
This Status parameter is filled with the demangle status. We can ignore this and just check if the function returns a non-nil value. For the mangled symbol __ZN6System8Sysutils14TStringBuilderC3ENS_13UnicodeStringEi, the result will be:
System::Sysutils::TStringBuilder::TStringBuilder(System::UnicodeString, int)
This is much better. The TStringBuilder::TStringBuilder segment is the C++ way of saying this is a constructor. In this case a constructor that takes two parameters of type UnicodeString and Integer.
I went it a little bit further by creating a utility that tries to convert this C++ symbol to a Pascal symbol. It is called goCppSymbolToPascal and you can find it in the unit Grijjy.SymbolTranslator. Running this on the C++ symbol above returns:
Sysutils.TStringBuilder.Create(String, Integer)
It omits the System namespace and tries to convert C++ types to Pascal.
The TgoExceptionReporter only does this for symbols that are defined in the module representing your app. For symbols in other modules (like system modules), it uses the C++ version.
Putting it all together
You can’t build a house with just 3 lego bricks, but it is enough to get some basics going. When the TgoExceptionReporter class intercepts an exception, it creates a report of type IgoExceptionReport. This interface contains 4 properties:
ExceptionMessage: the exception text (basically theException.Messageproperty).ExceptionLocation: the location of the exception. This is of typeTgoCallStackEntry, so it also contains information about where and in which routine the exception happened.CallStack: the call stack (or stack trace) leading up the the exception. This also includes calls into the exception handler itself. This is just an array ofTgoCallStackEntryrecords.Report: a textual version of the exception, including the stack trace. You can use this as a quick-and-easy way to view or save the report.
The IgoExceptionReport class uses Delphi’s messaging framework to broadcast a message containing this report to anyone interested. So the basic workflow for using TgoExceptionReporter is:
- Call
Application.OnException := TgoExceptionReporter.ExceptionHandler;to have the reporter intercept unhandled FMX exceptions. - Subscribe to the
TgoExceptionReportMessageto get notified of exception reports (by callingTMessageManager.DefaultManager.SubscribeToMessage(TgoExceptionReportMessage, HandleExceptionReport)). - In the message handler, handle the report in any way you want. For example:
- You can email it to your development team.
- You can send it to your cloud backend.
- You can show it to the user. However, note that the message may be sent from another thread than the UI thread, so you need to synchronize any UI calls with the main thread.
- You can send it to a service like HockeyApp.
- etc.
However, because the app may be unstable now (depending on the type of exception) it may be safest to just write the report to disk and terminate the app (by calling Halt). Then, the next time the app starts up, you can check for this file and handle the report at that point.
Demo Time!
The accompanying source code contains a small sample app that shows the exception reporter in action. It handles the exception report by saving it to the Documents folder and showing it to the user:
procedure TFormMain.HandleExceptionReport(const Sender: TObject;
  const M: TMessage);
var
  Report: IgoExceptionReport;
begin
  Assert(M is TgoExceptionReportMessage);
  Report := TgoExceptionReportMessage(M).Report;

  TFile.WriteAllText(
    TPath.Combine(TPath.GetDocumentsPath, 'ErrorReport.txt'),
    Report.Report);

  TThread.Queue(nil,
    procedure
    begin
      ShowReport(Report.Report);
    end);
end;
Remember that this message can be sent from any thread, so if you are going to access the UI, you need to synchronize it with the main thread. In the example above, I choose TThread.Queue to do this, so it doesn’t block.
You can use the sample to generate different kinds of exceptions:
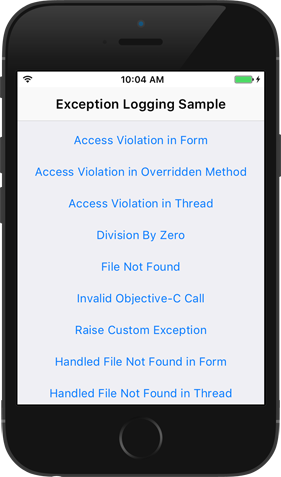
It creates error reports like this:
Division by zero
At address: $0098ADB4 (Fmain.TFormMain.ButtonDivByZeroClick(TObject*) + 120)

Call stack:
ErrorReportingSample      $0094F38C Grijjy.Errorreporting.TgoExceptionReporter.GlobalGetExceptionStackInfo(TExceptionRecord*) + 208
ErrorReportingSample      $0010A408 Sysutils.Exception.RaisingException(TExceptionRecord*) + 88
ErrorReportingSample      $0013FFD4 Sysutils.RaiseExceptObject(TExceptionRecord*) + 84
ErrorReportingSample      $000E8244 _RaiseAtExcept(TObject*, Pointer) + 184
ErrorReportingSample      $0013FB5C Sysutils.ErrorHandler(Byte, Pointer) + 340
ErrorReportingSample      $000E0290 ErrorAt(Byte, Pointer) + 80
ErrorReportingSample      $000DEDEC _IntDivByZero() + 24
ErrorReportingSample      $0098ADB4 Fmain.TFormMain.ButtonDivByZeroClick(TObject*) + 120
ErrorReportingSample      $0064B228 Fmx.Controls.TControl.Click() + 1364
ErrorReportingSample      $0075A850 Fmx.Stdctrls.TCustomButton.Click() + 32
ErrorReportingSample      $0064B9C8 Fmx.Controls.TControl.MouseClick(Uitypes.TMouseButton, set of Classes.System_Classes__1, Single, Single) + 140
ErrorReportingSample      $0090F4C0 Fmx.Forms.TCommonCustomForm.MouseUp(Uitypes.TMouseButton, set of Classes.System_Classes__1, Single, Single, Boolean) + 416
ErrorReportingSample      $008A3B80 Fmx.Platform.Ios.TFMXViewBase.DoLMouseUp(Single, Single, Boolean) + 208
ErrorReportingSample      $0088A84C Fmx.Platform.Ios.TFMXViewBase.touchesEnded(Iosapi.Foundation.NSSet, Iosapi.Uikit.UIEvent) + 732
ErrorReportingSample      $0098BDB0 DispatchToDelphi + 144
UIKit                     $8D6740C4 <redacted> + 2484
UIKit                     $8D66F328 <redacted> + 2988
UIKit                     $8D63FDA0 <redacted> + 340
UIKit                     $8DE2975C <redacted> + 2736
UIKit                     $8DE23130 <redacted> + 784
In this example, the error occurred 120 bytes into the ButtonDivByZeroClick method. The call stack shows how it got there.
Some notes:
- The call stack also shows the calls involved in intercepting the exception. You could filter those out if you want to.
- Some symbols appear as
redacted. iOS may redact certain symbols that appear in system libraries. Fortunately, these aren’t of much interest. - The C++-to-Pascal translator cannot translate all C++ constructs. For example the
set of Classes.System_Classes__1type in the sample report is not very useful. - The call stack may not be 100% accurate. You may sometimes notice that entries are missing from the call stack, such as the routine where the error occurred. That’s why I always put information about the error location at the top of the report.
Where to go from here?
As mentioned before, this is in no way a complete error reporting solution. But the building blocks presented here may help you build one. Building a robust error reporter is hard. These are some things you may want to keep in mind:
- Depending on the type of exception, the application may be in an unstable state when the exception is intercepted. You should anticipate this and try to do as little as possible. For example, just write the report (or the information to create a report) to disk and terminate the app. Then handle the report on application restart.
- You may want to suspend all other threads when handling the exception, so they won’t interfere in any way.
- You may want to handle the exception in a dedicated thread, to try to shield it somewhat from the thread the raised the exception.
- It may be beneficial to also generate stack traces for all other threads. However, this is not trivial and requires quite a bit of low level code. Since you mostly care about the thread that raised the exception, this may not be worth the trouble.
- If something really bad happens, the app may still crash out of memory before we get a chance to handle the exception. iOS will generate a crash report then. Unfortunately, you cannot access this report from code. But the device will send it to your iTunes (Connect) account so you can pick it up there. It will be hard to figure out the crash though, since Apple is probably not able to (correctly) symbolicate the crash report.
I hope the building blocks presented here help you get started. Do whatever you want with them. Just don’t hold us responsible if anything bad happens…

Very nice!
My question: Is this possible also for MacOS?
LikeLike
I’m sure something like this is possible for macOS. I just never looked into it since our company mostly focuses on mobile. I think the EurekaLog guys are looking into this…
LikeLiked by 1 person
What about Android?
LikeLike
I’m working on it;) Expect it in the next post soon…
LikeLike
Erik, congratulation for your work ! just one question do we need to generate the .dsym file ? because i would like to know if i can skip it in release distribution, but i still want to have the error reporting log
LikeLike
Thanks! You don’t need to deploy a .dsym file. The symbol information required for the stack trace is inside the executable itself.
LikeLike
Thanks! and again congratulation ….
LikeLike
Hi Erik,
Do you know if their is a way to add more call stack entries in the report ?
For example I have this report :
Access violation at address 0000000184D48910, accessing address 0000000BDC5CBEB8
At address: $0000000184D48910 (objc_msgSend + 16)
Call stack:
MyProj $0000000103D4C5E4 Grijjy.Errorreporting.TgoExceptionReporter.GlobalGetExceptionStackInfo(TExceptionRecord*) + 196
MyProj $000000010302B26C Sysutils.Exception.RaisingException(TExceptionRecord*) + 88
MyProj $00000001030622E4 Sysutils.RaiseExceptObject(TExceptionRecord*) + 84
MyProj $0000000103007618 _RaiseAtExcept(TObject*, Pointer) + 128
MyProj $0000000103029A80 Internal.Excutils.SignalConverter(NativeUInt, NativeUInt, NativeUInt) + 68
Foundation $00000001865049EC + 204
CoreFoundation $0000000185B1F6B0 + 196
CoreFoundation $0000000185B13828 + 120
libsystem_pthread.dylib $00000001857A057C + 572
libsystem_pthread.dylib $00000001857A02CC + 88
libsyste
But it’s too short and i would like to have more entries, is it possible ?
LikeLike
You can use the TgoExceptionReporter.MaxCallStackDepth property to increase the default depth of 20.
LikeLike
Thanks Erik ! Great job !!
LikeLike
Thank you for your work – it really helped.
But there were some questions left (maybe I’m wrong):
1) Why not use RaiseExceptObjProc? It seems that it is called in all cases of exceptions.
2) Also, because ExceptProc is redefined by you, System.SysUtils.ExceptHandler will not be called and therefore the process will not be terminated. I don’t think this is a good idea …
LikeLike
Hi Erik, maybe you can take a look at https://stackoverflow.com/questions/54400408/how-to-know-the-exact-line-number-that-produce-an-exception?noredirect=1#comment95616658_54400408
the question is : How to know the exact line number that produce an exception ? The problem is that grijjy gave me the function name where the error occur but not the exact line number.
LikeLike
Delphi doesn’t provide this information. Not in the debug information, and not in map files. This makes it very difficult to retrieve a line number. So the best you can do is use the offset into the routine that errored.
LikeLike
thanks Eriik! Do you know how I can work with the offset without recompiling the source because we can not guarantie to get the same assembly code as EMB new compilers are not determistic.
LikeLike
ad 1) It’s been a while, but I seem to remember that RaiseExceptObjProc is not called for all exceptions, but only for “software” exceptions raised from code. It wouldn’t catch “hardware” exceptions like access violations or FPU errors (division by zero and such). But feel free to experiment with RaiseExceptObjProc. Maybe it works fine for you!
ad 2) That is a design decision. If you would rather terminate the app as well, then feel free to modify it. As I stated, this is not a complete error reporting solution, but just some building blocks. Modify it to fit your needs! And of course, improvements are welcome as pull requests!
LikeLike
Hello Erik,
Congratulations for your excellent work!
Just for the record, in addition to your code, I made a simple tutorial to help when there are no chance to handle the exception.
https://github.com/viniciusfbb/fmx_tutorials/tree/master/delphi_ios_exploring_app_crashes
LikeLike
Interesting! Thanks for the link.
Now we just need code to grab the crash report from the device and send it to the developer…
LikeLiked by 1 person
Erik, when you upload your app to Apple Store, every time that your app crash, the iOS generate this crash file and send to the developer automatically… To download this users crashs files you need just to log into https://itunesconnect.apple.com/. The Apple system is perfect.
LikeLike