
A while ago, I started a small series about trapping exceptions and turning them into an error report for consumption by your development team. This enables you to get information about errors that happen out “in the field”.
The first part focused on the iOS platform and the second part on Android. In this part we add support for the 64-bit Intel macOS platform. And I may tackle the ARM macOS platform in a future post.
Even though Intel macOS is going the way of the dinosaurs, there are still a lot of Intel Macs out there. So having an error reporting solution for this platform will be useful for some time to come.
Like I said in the first part, there (probably) won’t be any support for the Windows platform, since there are already excellent solutions out there for Windows, like EurekaLog and MadExcept.
You don’t need to read the second part in this series to follow this post, but I recommend reading the first part since it lays some groundwork and most of the iOS specific code in there applies to the macOS platform as well.
I would also like to reiterate that this is not a complete error reporting solution. As the title suggests, we provide the building blocks that you can use to build your own solution.
As before, you can find the accompanying source code on GitHub as part of the JustAddCode repository.
Developer Guide
Before we look at some of the implementation details (for those who care), let’s take a look at the steps you need to take to enable error reporting on macOS.
One-Time Setup
For the Mac platform, I created a Line Number Generator (LNG.exe) that extracts line number information from the Debug Symbols file (.dSYM file) that the Delphi compiler generates. This tool creates a file with a .gol extension that contains just this line number information. When you deploy this file with your app (more on this later), it will be used to find the line numbers for the call stack entries, giving you more information about where the actual exception happened.
You need to compile this tool once, so that it can be used with build events later. You can find this tool in the Git repository in the “ErrorReporting\Tools\LineNumberGenerator” directory.
Project Settings
To enable error reporting in your own macOS project, you should first follow the steps described in the first part of this series. In particular, you should set the Application.OnException property and subscribe to the TgoExceptionReportMessage. You could use the ErrorReportingSample project in the repository as a template.
You should also enable embedding of debug information to receive useful call stacks. Do this by setting these compiler options (through the “Project | Options…” menu option).
- Under “Building | Delphi Compiler | Compiling”:
- Debug information: Limited Debug Information. There is no need for full debug information for this purpose.
- Local symbols: False
- Symbol reference info: None
- Use debug .dcus: True if you want line number information for RTL and FMX units. Otherwise False.
- Under “Building | Delphi Compiler | Linking”:
- Debug information: True
You should set these options for the Mac configuration you deploy to your clients (eg. “Release configuration – macOS 64-bit platform”):

Build Events
Next, you need to add a post-build event to run the Line Number Generator tool:
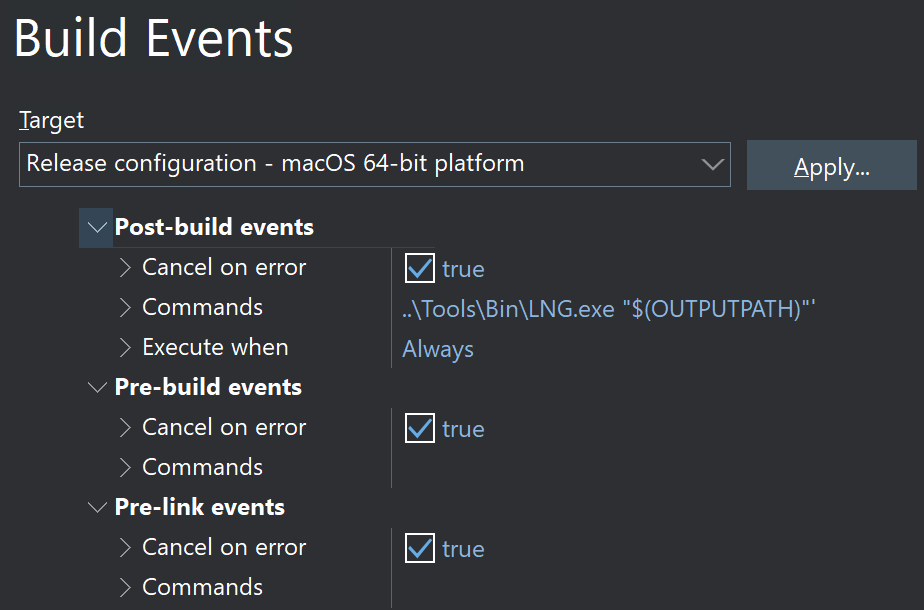
The “Cancel on error” setting should be left to True so compilation will fail if the tool fails or cannot be found. The “Commands” setting should be set to the name of the tool, passing the name of the generated executable as the parameter (you should use the "$(OUTPUTPATH)" variable for this, including the double quotes). If you put the LNG.exe tool somewhere in your path, then you don’t need to specify a directory for the command. Otherwise, you need to provide an absolute or relative directory.
If you compile the project now, then a .gol file will be generated in the same directory as the generated executable. For the sample application in the repository, this is a file called “ErrorReportingSample.gol” in the “Example\OSX64\Release” directory. This file must be deployed with your app:
Deployment
Open the Deployment manager (Project | Deployment) and add the just generated .gol file (found in the “OSX64\<Config>\” directory). Set the remote path to “Contents\MacOS\”:
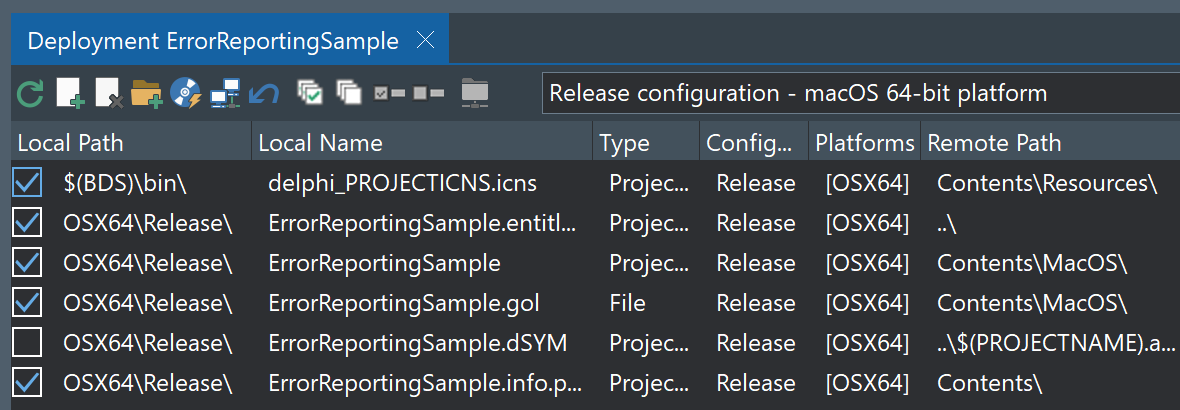
For release builds, you should not deploy the .dSYM file that the Delphi compiler generated, and uncheck it in the deployment manager.
Test Drive
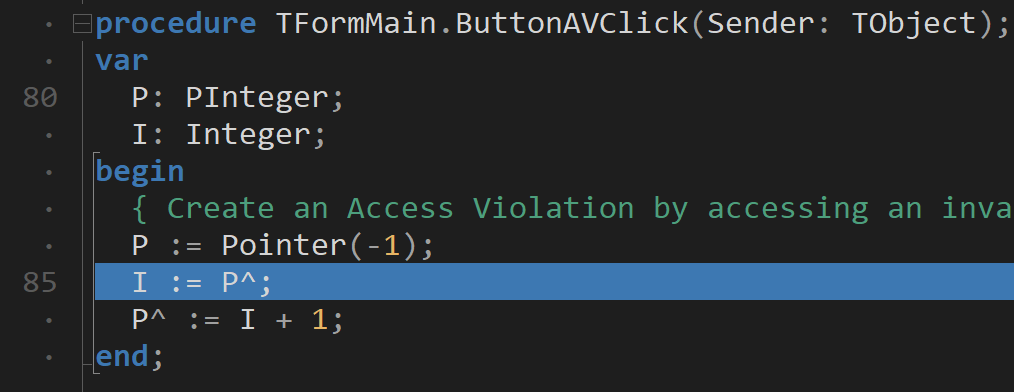
Now to test this out, build and run the ErrorReportingSample application in the repository for macOS. After you press the “Access Violation in Form” button, you should get an error report like this:

Because we used the Line Number Generator tool, you can see that the exception originates at line 85 in the FMain unit, in the TFormMain.ButtonAVClick method. And sure enough, that is where the culprit is:
Under the Hood
Most of the exception handling code for macOS is identical to iOS: the first step is intercepting any unhandled exceptions, followed by retrieving a stack trace and finally symbolicating the stack trace. These steps are detailed in the first part in this series. The only main difference is the inclusion of line numbers as generated by the LNG tool. The remainder of this post peeks a little behind the curtain at the inner workings of this tool. You don’t need this information to make use of it though, so feel free to skip it. But you may find it interesting if you want to know a bit more about the executable and debug information format used by macOS apps.
Mach-O Files
MacOS (and iOS) executables are stored in a format called Mach-O, short for Mach Object files (where Mach is the name of the kernel for these operating systems). Any debug information is stored in a separate Mach-O file with a .dSYM extension.
The Mach-O format is fairly simple:

It starts with a small header, followed by some load commands which loads the actual data segments, where each segment can contain multiple sections. The header contains information the file, including the type of CPU the file supports (which is CPU_TYPE_X86_64 in this case) and how many load commands it contains.
A load command is just a simple record:
type
  load_command = record
    cmd: UInt32;     (* type of load command *)
    cmdsize: UInt32; (* total size of command in bytes *)
  end;
It contains the type of command and its size. For our purposes, we only care about two types:
LC_UUID: this command contains a GUID that we use to check if the executable has the same ID as the .dSYM file. The tool will fail if it does not.LC_SEGMENT_64: this command loads a 64-bit segment. The segment in turn contains one or more sections.
The MachO unit of the LNG tool has a small class that wraps loading the segments from an executable or .dSYM file:
type
  TSection = class
  ...
  public
    function Load: TBytes;

    property SegmentName: String read GetSegmentName;
    property SectionName: String read GetSectionName;
  end;

type
  TMachOFile = class
  ...
  public
    procedure Load(const AFilename: String);

    { Unique ID for this Mach-O file.
      An executable and corresponding dSYM must have the same ID. }
    property ID: TGUID read FID;

    property Sections: TObjectList<TSection> read FSections;
  end;
Each section has a name, as well as the name of the segment it belongs to. For our purposes, we only care about the segment named ‘__DWARF’, which contains the debug information. This segment contains various sections (called ‘__debug_info’, ‘__debug_line’ etc.) with the actual debug information (which is discussed next). The TSection class also has a Load method that loads the section into memory.
Apple no longer provides a specification of the Mach-O format, but (of course) PDF copies of it can still be found on the web, such as this one. Take a look at it for more details.
DWARF Debug Information
The ‘__DWARF’ segment in the .dSYM file contains various bits of debug information, including line number information.
The DWARF specification is pretty complex, and still being updated and extended. There is a nice Introduction to the DWARF Debugging Format document that does a good job at providing both a high-level overview as well as implementation details. There is also the official DWARF specification (version 5 at the time of writing), which provides all the information you need for parsing DWARF sections.
So I will not go into too much detail about the DWARF format here, but instead highlight some of the information in there that we need for extracting line numbers.
At a high level, the ‘__DWARF’ segment contains 4 sections that we are interested in:
- ‘__debug_info’: the core DWARF data containing Debug Information Entries (DIEs).
- ‘__debug_abbrev’: abbreviations used in the ‘__debug_info’ section. Abbreviations are used as a way to compress the data by replacing duplicated tags + attributes with a single small abbreviation.
- ‘__debug_str’: contains a table of strings referenced by the ‘__debug_info’ section.
- ‘__debug_line’: contains a Line Number program, which is the piece we are interested in the most.
You can take a look at the Dwarf unit of the LNG tool for the parsing details.
Line Number Program
The ‘__debug_line’ section maps code (VM) addresses to their corresponding line numbers. It is the most complicated section to parse, since it contains a sort of program (actually a state machine) that efficiently stores a potentially large number of (address, line) pairs. We use a stripped down version of this format to efficiently store line number information in the generated .gol file so it doesn’t get too big.
The state machine uses a simple compression algorithm that takes advantage of the facts that VM addresses always increase, and that the difference between consecutive VM addresses is usually small.
Similarly, it is efficient if the difference between two consecutive line numbers is small. A lot of the time, line numbers are increasing, but because of optimization and (compilation) unit changes, line numbers may also decrease.
The state machine uses 1-byte Opcodes to “run” the program. If the VM address difference is at most 63, and the line number difference is between 1 and 4 (inclusive), then a single byte Opcode suffices to store this (address, line) pair. The OpCode is calculated as:
Opcode := (LineAdvance - 1) + (AddressAdvance - 1) * 4;
This puts the line advance in the lower 2 bits of the Opcode and the address advance in the upper 6 bits. So the mapping looks like this:
| Opcode | LineAdvance | AddressAdvance |
|---|---|---|
| 0 | 1 | 1 |
| 1 | 2 | 1 |
| 2 | 3 | 1 |
| 3 | 4 | 1 |
| 4 | 1 | 2 |
| 5 | 2 | 2 |
| … | ||
| 247 | 4 | 62 |
| 248 | 1 | 63 |
| 249 | 2 | 63 |
| 250 | 3 | 63 |
| 251 | 4 | 63 |
For example, if the difference between the previous and current VM address is 63, and the difference between the previous and current line number is 2, then the Opcode is 249.
The remaining Opcodes are used in case the address and line differences are outside of these bounds:
- 252: adds the value 63 to the current address. Is used when the total address advance is between 63 and 126 and the line advance is between 1 and 4. This opcode should be followed by a regular opcode in the 0-247 range to set the final address and line.
- 253: used when the line number difference is positive. In this case, this Opcode is followed by two values: the address advance and the line advance. These values are stored in a “variable size integer” (VarInt) format to reduce storage space.
- 254: used when the line number difference is negative. Here, the Opcode is also followed by an address advance, but then followed by the full line number (instead of a line advance). Both are also in the VarInt format.
The VarInt format splits an unsigned integer value into chunks of 7 bits. Each 7-bit chunk is encoded in a 8-bit byte, where the highest bit is set if another 7-bit chunk follows.
This scheme is not too complicated but reduces the size of the line number information significantly.
All this Mach-O and DWARF parsing comes together in the Generator unit of the LNG tool, which has a very simple API:
type
  TLineNumberGenerator = class
  ...
  public
    constructor Create(const APath: String);
    procedure Run;
  end;
You basically create it using the path to the executable (which is the "$(OUTPUTPATH)" variable set in the post-build event), and then call Run. This loads the .dSYM file using the Mach-O parser and extracts the debug information using tools in the Dwarf unit. It then writes the .gol file using the state machine program described above.
Using the .gol File
Finally, back on the app side in the error reporting code, the .gol file is loaded from the bundle and used to find the line number that matches the exception or call stack address. This functionality is encapsulated in the TgoLineNumberInfo class, which also has a very simple API:
type
  TgoLineNumberInfo = class
  ...
  public
    constructor Create;

    { Returns source line number corresponding to given address,
      or 0 if not available. }
    function Lookup(const AAddress: UIntPtr): Integer;
  end;
The main method is Lookup which returns the line number closest to the given address, or 0 if not available. When this method returns 0, it usually means that the address is outside the range of the executable, for example in a system call or external library.
Next Steps
With these new building blocks, you should be able to add some basic error reporting to your Intel Mac apps. In a future post, I may add some missing pieces to get this to work for ARM Mac apps as well.
